


 |
RMC811S- RESEARCH METHODS FOR NATURAL SCIENCES -2NDt Opp - JULY 2022 |
|
|
1 Page 1 |
▲back to top |
nAm I BIA un IVERSITY
OF SCIEnCE Ano TECHnOLOGY
Faculty of Health, Applied Sciencesand Natural Resources
Department Natural Resources and Agricultural Sciences
QUALIFICATION:Bachelor of Natural Resource Management Honours
QUALIFICATIONCODE: 08BNRH
LEVEL:8
COURSE: Research Methods for Natural Sciences COURSECODE: RMC811S
DATE:July 2022
SESSION: July
DURATION: 3 (three) hours
MARKS: 100
SECONDOPPORTUNITY[SUPPLEMENTARYEXAMINATION QUESTIONPAPER
EXAMINER(S)
Or. T. Nzuma (Section A: Scientific Writing)
Dr. M. Mbidzo (Section B: Statistics)
MODERATOR: Dr. M. Mwale
THIS QUESTIONPAPERCONSISTSOF 7 PAGES
(Excluding this front page)
INSTRUCTIONS
1. Answer ALLthe questions
2. Write clearly and neatly
3. Number the answers clearly
4. The use of a calculator is permissible
1
|
|
2 Page 2 |
▲back to top |
SECTIONA: SCIENTIFICWRITING
Question 1
[6]
What is the importance of scientific writing?
Question 2
[4)
How do you avoid plagiarism?
Question 3
[15)
What are the common errors made in literature review?
SUBTOTAL
[25)
SECTIONB: STATISTICS
Question 1
[10)
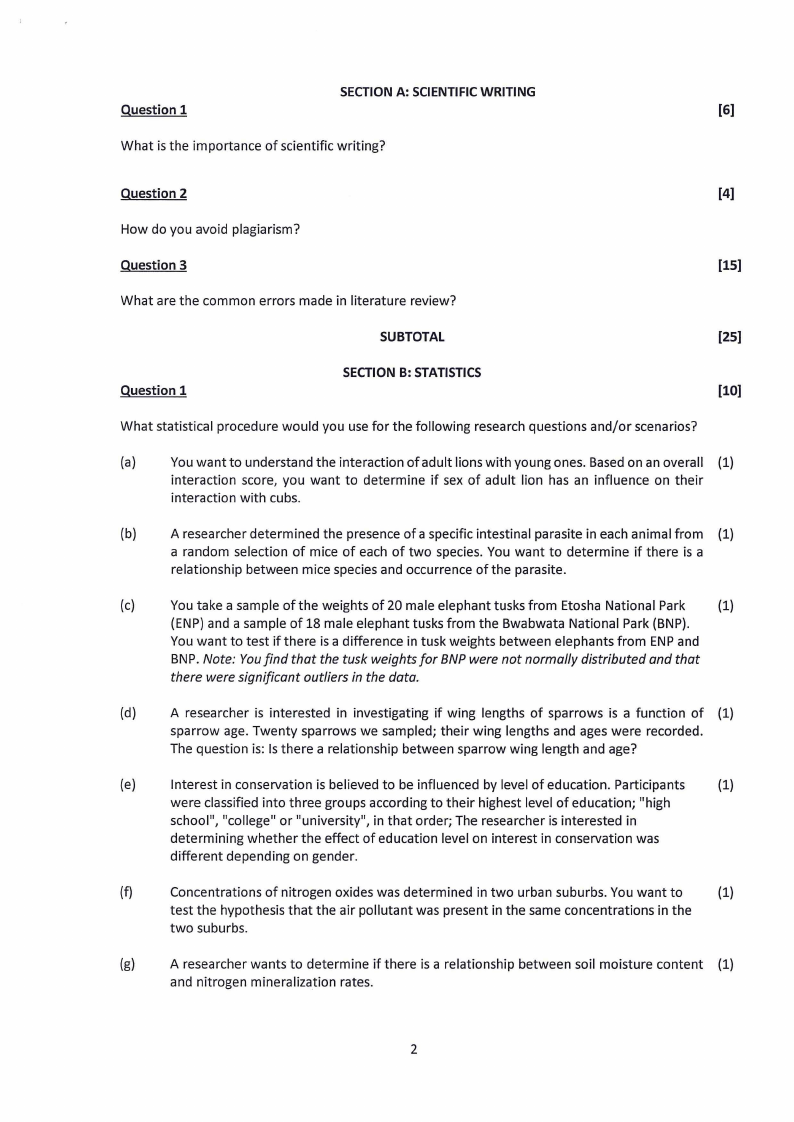
What statistical procedure would you use for the following research questions and/or scenarios?
(a)
You want to understand the interaction of adult lions with young ones. Basedon an overall (1)
interaction score, you want to determine if sex of adult lion has an influence on their
interaction with cubs.
(b)
A researcher determined the presence of a specific intestinal parasite in each animal from (1)
a random selection of mice of each of two species. You want to determine if there is a
relationship between mice species and occurrence of the parasite.
(c)
You take a sample of the weights of 20 male elephant tusks from Etosha National Park
(1)
(ENP}and a sample of 18 male elephant tusks from the Bwabwata National Park (BNP}.
You want to test if there is a difference in tusk weights between elephants from ENP and
BNP.Note: Youfind that the tusk weights for BNP were not normally distributed and that
there were significant outliers in the data.
(d)
A researcher is interested in investigating if wing lengths of sparrows is a function of (1)
sparrow age. Twenty sparrows we sampled; their wing lengths and ages were recorded.
The question is: Is there a relationship between sparrow wing length and age?
(e)
Interest in conservation is believed to be influenced by level of education. Participants
(1)
were classified into three groups according to their highest level of education; "high
school", "college" or "university", in that order; The researcher is interested in
determining whether the effect of education level on interest in conservation was
different depending on gender.
(f)
Concentrations of nitrogen oxides was determined in two urban suburbs. You want to
(1)
test the hypothesis that the air pollutant was present in the same concentrations in the
two suburbs.
(g)
A researcher wants to determine if there is a relationship between soil moisture content (1)
and nitrogen mineralization rates.
2
|
|
3 Page 3 |
▲back to top |
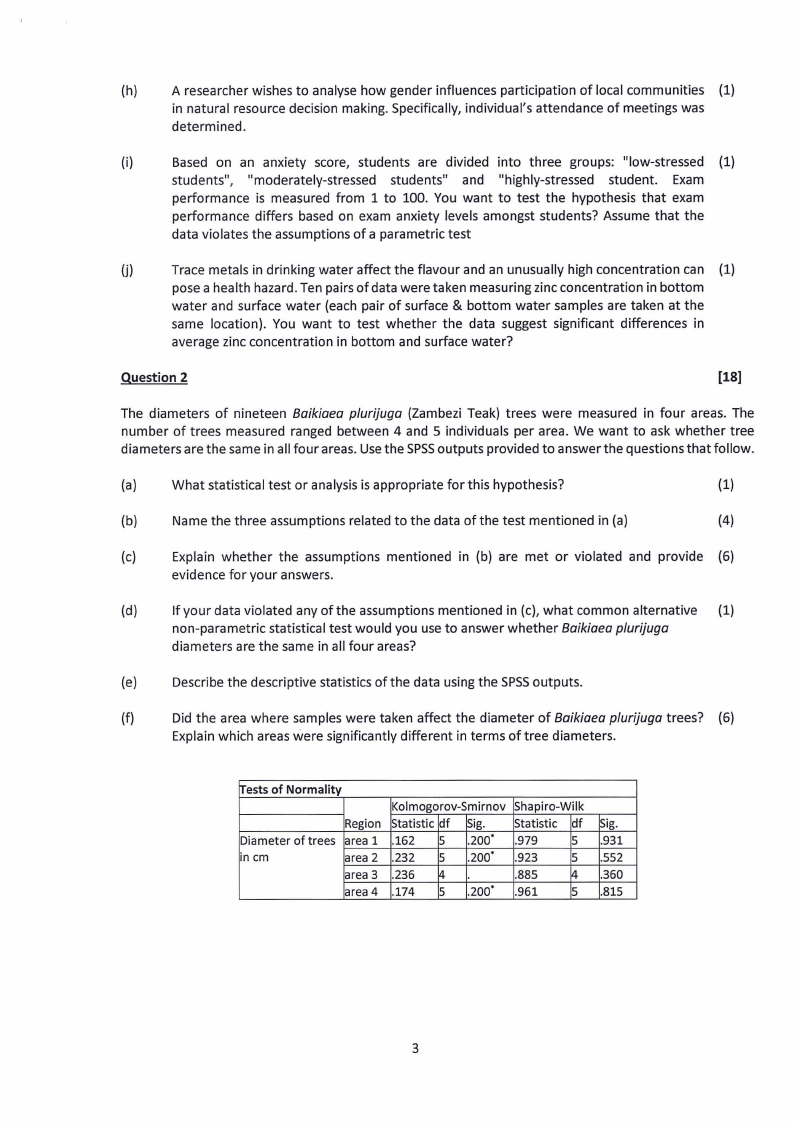
{h)
A researcher wishes to analyse how gender influences participation of local communities {1}
in natural resource decision making. Specifically, individual's attendance of meetings was
determined.
(i)
Based on an anxiety score, students are divided into three groups: "low-stressed {1}
students", "moderately-stressed students" and "highly-stressed student. Exam
performance is measured from 1 to 100. You want to test the hypothesis that exam
performance differs based on exam anxiety levels amongst students? Assume that the
data violates the assumptions of a parametric test
{j}
Trace metals in drinking water affect the flavour and an unusually high concentration can {1}
pose a health hazard. Ten pairs of data were taken measuring zinc concentration in bottom
water and surface water {each pair of surface & bottom water samples are taken at the
same location). You want to test whether the data suggest significant differences in
average zinc concentration in bottom and surface water?
Question 2
[18]
The diameters of nineteen Baikiaea p/urijuga {Zambezi Teak) trees were measured in four areas. The
number of trees measured ranged between 4 and 5 individuals per area. We want to ask whether tree
diameters are the same in all four areas. Usethe SPSSoutputs provided to answer the questions that follow.
(a)
What statistical test or analysis is appropriate for this hypothesis?
{1)
{b)
Name the three assumptions related to the data of the test mentioned in {a)
{4)
(c)
Explain whether the assumptions mentioned in (b) are met or violated and provide (6)
evidence for your answers.
(d)
If your data violated any of the assumptions mentioned in (c), what common alternative (1)
non-parametric statistical test would you use to answer whether Baikiaea plurijuga
diameters are the same in all four areas?
(e)
Describe the descriptive statistics of the data using the SPSSoutputs.
(f)
Did the area where samples were taken affect the diameter of Baikiaea plurijuga trees? (6)
Explain which areas were significantly different in terms of tree diameters.
Tests of Normality
Kolmogorov-Smirnov Shapiro-Wilk
Region Statistic df Sig. Statistic df 5ig.
Diameter of trees area 1 .162 5 .200· .979
5 .931
in cm
area 2 .232 5 .200· .923
5 .552
area 3 .236 4
.885
14 .360
area 4 .174 5 .200· .961
5 .815
3
|
|
4 Page 4 |
▲back to top |

110.00
100.00
E 90.00
-lu".l~,' so.oo--
-
--
0
I 70.00
15
60.00 f-----------------·
50.00 f---------------~--
area 1
area 2
Area
area 3
area4
Statistics
Diameter of trees in cm
area 1
area 2
area 3
area 4
[Total
N Mean
l5 60.6200
l5 69.3000
100.3500
l5 S6.2400
19 78.0105
Std.
Deviation
3.06464
2.92660
2.76707
2.89620
15.55402
95% Confidence Interval for
Mean
Std. Error Lower Bound Upper Bound
1.37055 56.8148
64.42S2
1.30882 65.6661
72.9339
1.38353 95.9470
104.7530
1.29522 82.6439
89.8361
3.56834 70.5137
85.5073
Minimum Maximum
57.00 65.00
66.30 74.00
96.50 102.60
83.10 90.30
57.00 102.60
rT"estosf Homogeneity of Variances
Diameter of
~rees in cm
Based on Mean
Based on Median
Based on Median and with adjusted df
Based on trimmed mean
Levene
Statistic
.034
.024
.024
.035
dfl df2
Sig.
3
15
.991
3
15
.995
3
14.638 .995
3
15
.991
~NOVA
Diameter of trees in cm
Sum of Squares df
Between Groups 4226.348
3
Within Groups 128.350
15
[Total
4354.698
18
Mean Square
1408.783
8.557
F
164.642
Sig.
<.001
4
|
|
5 Page 5 |
▲back to top |
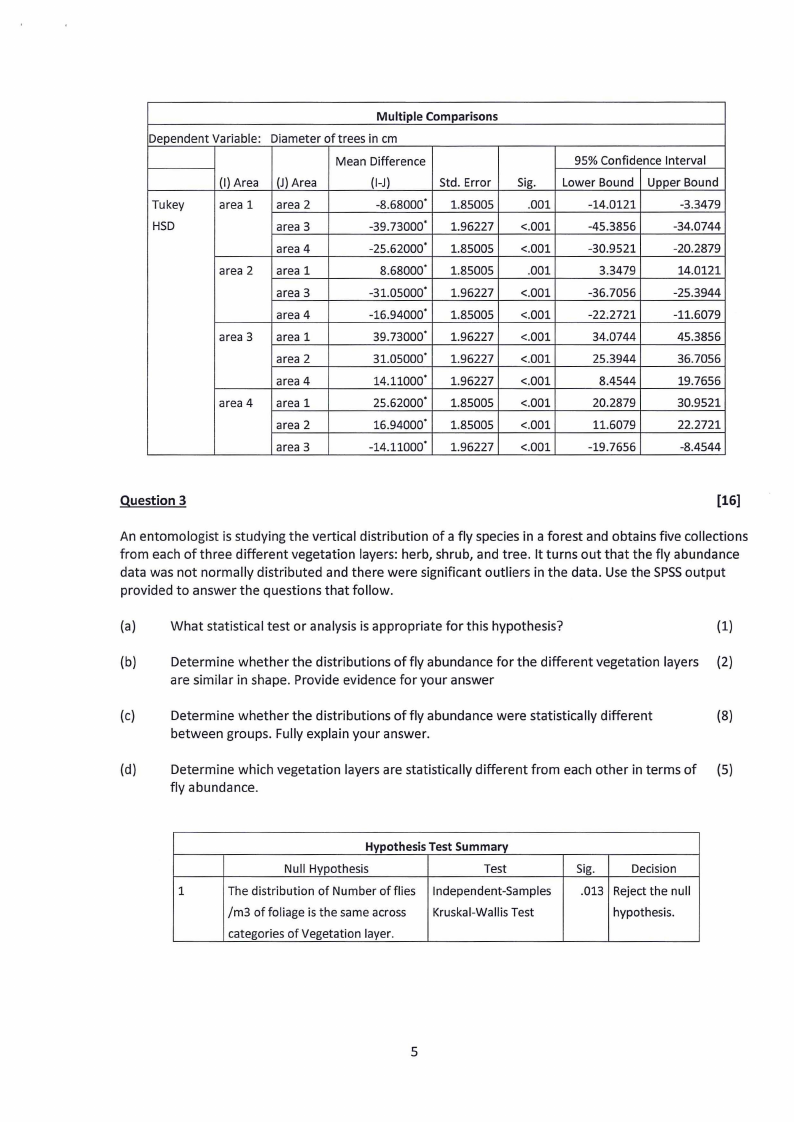
Multiple Comparisons
Dependent Variable: Diameter of trees in cm
Mean Difference
(I) Area (J) Area
(1-J)
Std. Error
Tukey
area 1 area 2
-8.68000. 1.85005
HSD
area 3
-39.73000· 1.96227
area 4
-25.62000· 1.85005
area 2 area 1
8.68000. 1.85005
area 3
-31.05000. 1.96227
area 4
-16.94000. 1.85005
area 3 area 1
39.73000· 1.96227
area 2
31.05000· 1.96227
area 4
14.11000. 1.96227
area 4 area 1
25.62000· 1.85005
area 2
16.94000. 1.85005
area 3
-14.11000. 1.96227
95% Confidence Interval
Sig. Lower Bound Upper Bound
.001
-14.0121
-3.3479
<.001
-45.3856
-34.0744
<.001
-30.9521
-20.2879
.001
3.3479
14.0121
<.001
-36.7056
-25.3944
<.001
-22.2721
-11.6079
<.001
34.0744
45.3856
<.001
25.3944
36.7056
<.001
8.4544
19.7656
<.001
20.2879
30.9521
<.001
11.6079
22.2721
<.001
-19.7656
-8.4544
Question 3
[16]
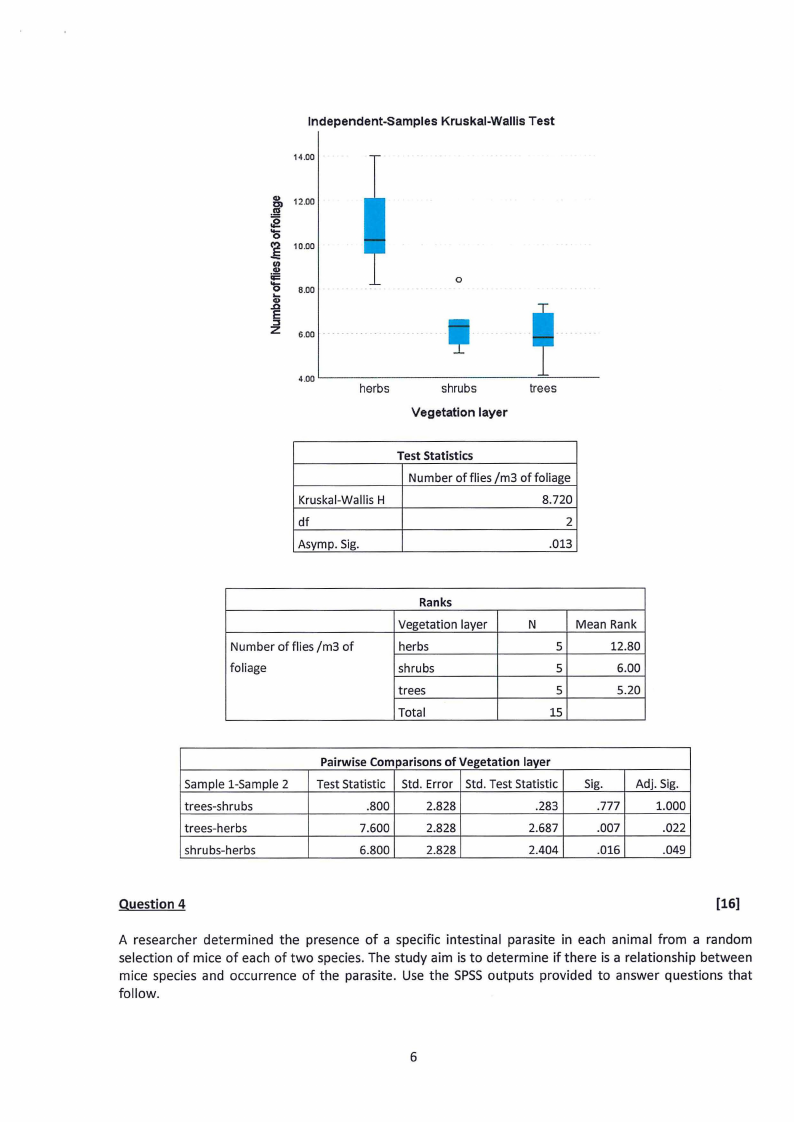
An entomologist is studying the vertical distribution of a fly species in a forest and obtains five collections
from each of three different vegetation layers: herb, shrub, and tree. It turns out that the fly abundance
data was not normally distributed and there were significant outliers in the data. Use the SPSSoutput
provided to answer the questions that follow.
(a)
What statistical test or analysis is appropriate for this hypothesis?
(1)
(b)
Determine whether the distributions of fly abundance for the different vegetation layers (2)
are similar in shape. Provide evidence for your answer
(c)
Determine whether the distributions of fly abundance were statistically different
(8)
between groups. Fully explain your answer.
(d)
Determine which vegetation layers are statistically different from each other in terms of (5)
fly abundance.
Hypothesis Test Summary
Null Hypothesis
Test
Sig.
Decision
1
The distribution of Number of flies Independent-Samples
.013 Reject the null
/m3 of foliage is the same across Kruskal-Wallis Test
hypothesis.
categories of Vegetation layer.
5
|
|
6 Page 6 |
▲back to top |
Independent-Samples Kruskal-Wallis Test
14.00
-~& 12.00
'o
i 10.00
Ill
Q)
ii=
...'o 8.00
.Q.c)
E
z:::J
6.00
··········
4.00 ~-----------------
herbs
,0
...
shrubs
Vegetation layer
'trees
Test Statistics
Number of flies /m3 of foliage
Kruskal-Wallis H
8.720
df
2
Asymp. Sig.
.013
Number of flies /m3 of
foliage
Ranks
Vegetation layer
herbs
shrubs
trees
Total
N
Mean Rank
5
12.80
5
6.00
5
5.20
15
Sample 1-Sample 2
trees-shrubs
trees-herbs
shrubs-herbs
Pairwise Comparisonsof Vegetation layer
Test Statistic Std. Error Std. Test Statistic
.800
2.828
.283
7.600
2.828
2.687
6.800
2.828
2.404
Sig.
.777
.007
.016
Adj. Sig.
1.000
.022
.049
Question 4
[16)
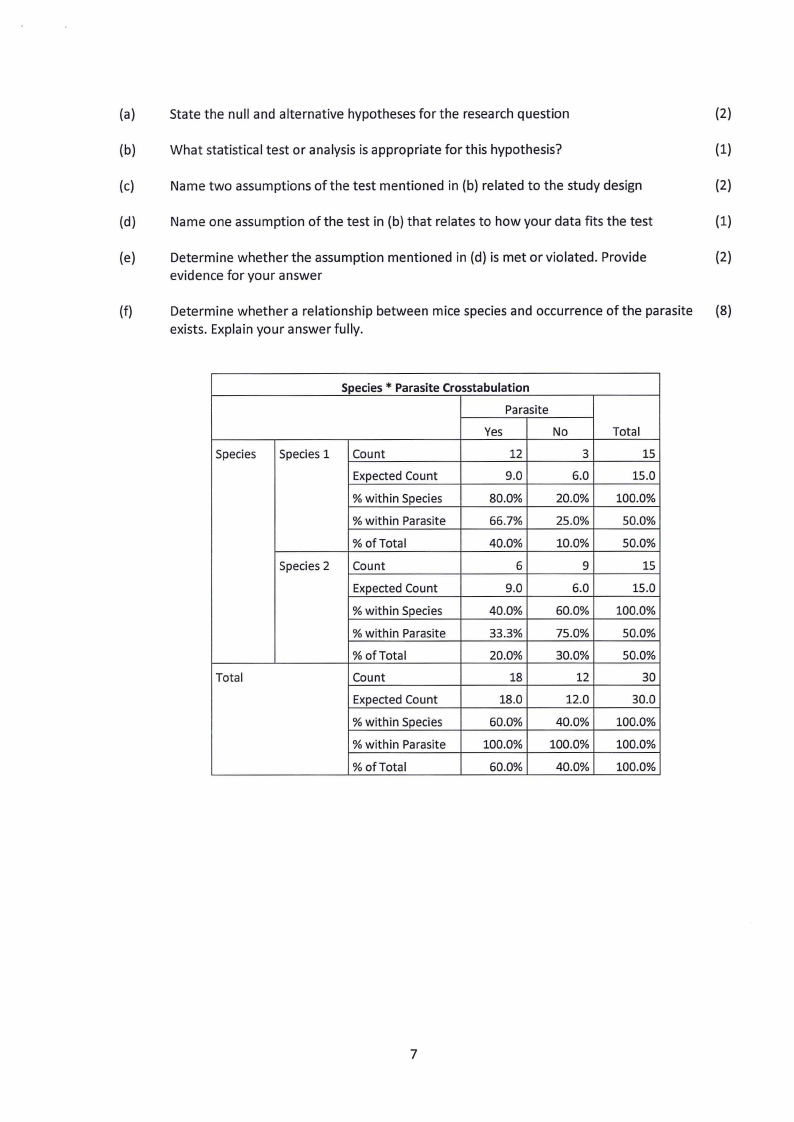
A researcher determined the presence of a specific intestinal parasite in each animal from a random
selection of mice of each of two species. The study aim is to determine if there is a relationship between
mice species and occurrence of the parasite. Use the SPSS outputs provided to answer questions that
follow.
6
|
|
7 Page 7 |
▲back to top |
(a)
State the null and alternative hypotheses for the research question
(2)
(b)
What statistical test or analysis is appropriate for this hypothesis?
(1)
(c)
Name two assumptions of the test mentioned in (b) related to the study design
(2)
(d)
Name one assumption of the test in (b) that relates to how your data fits the test
(1)
(e)
Determine whether the assumption mentioned in (d) is met or violated. Provide
(2)
evidence for your answer
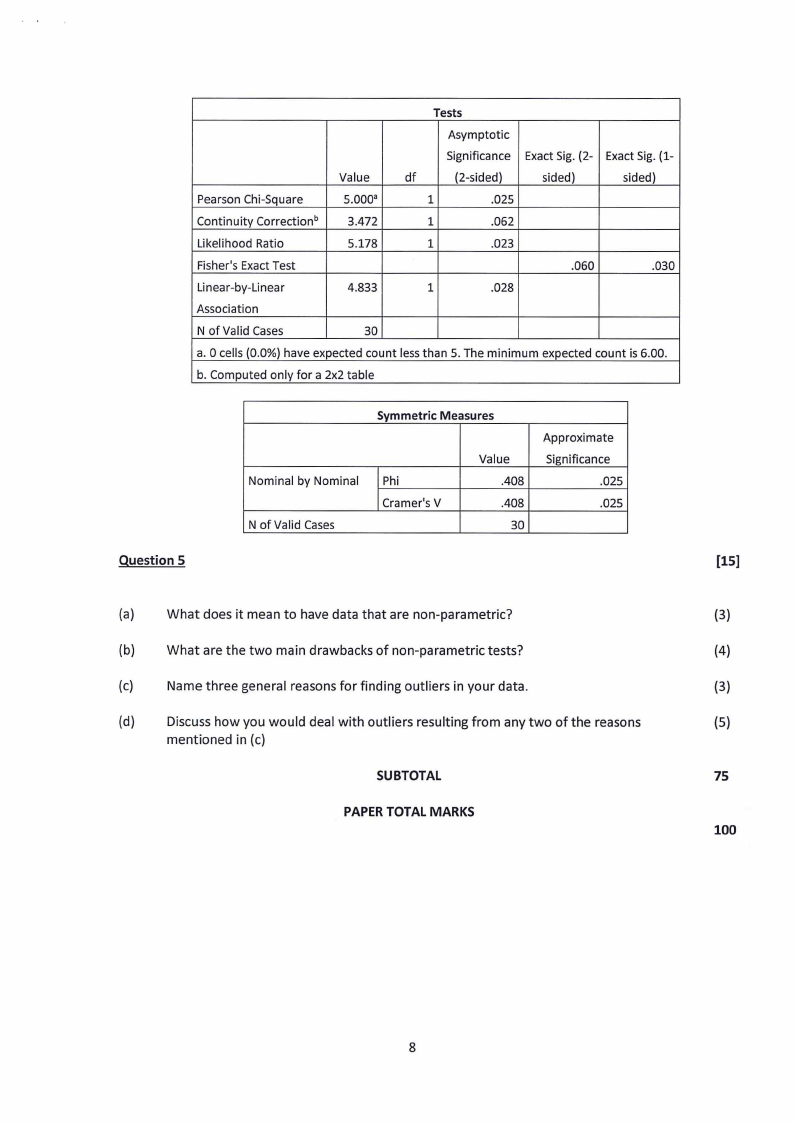
(f)
Determine whether a relationship between mice species and occurrence of the parasite (8)
exists. Explain your answer fully.
Species
Total
Species* ParasiteCrosstabulation
Parasite
Yes
No
Species 1 Count
12
3
Expected Count
9.0
6.0
% within Species
80.0%
20.0%
% within Parasite
66.7%
25.0%
% of Total
40.0%
10.0%
Species 2 Count
6
9
Expected Count
9.0
6.0
% within Species
40.0%
60.0%
% within Parasite
33.3%
75.0%
% of Total
20.0%
30.0%
Count
18
12
Expected Count
18.0
12.0
% within Species
60.0%
40.0%
% within Parasite
100.0% 100.0%
% of Total
60.0%
40.0%
Total
15
15.0
100.0%
50.0%
50.0%
15
15.0
100.0%
50.0%
50.0%
30
30.0
100.0%
100.0%
100.0%
7
|
|
8 Page 8 |
▲back to top |
Tests
Asymptotic
Significance Exact Sig. (2- Exact Sig. (1-
Value
df
(2-sided)
sided)
sided)
Pearson Chi-Square
5.ooo•
1
.025
Continuity Correctionb
3.472
1
.062
Likelihood Ratio
5.178
1
.023
Fisher's Exact Test
.060
.030
Linear-by-Linear
4.833
1
.028
Association
N of Valid Cases
30
a. 0 cells (0.0%) have expected count less than 5. The minimum expected count is 6.00.
b. Computed only for a 2x2 table
Question 5
Nominal by Nominal
N of Valid Cases
Symmetric Measures
Phi
Cramer's V
Value
.408
.408
30
Approximate
Significance
.025
.025
[15]
(a) What does it mean to have data that are non-parametric?
(3)
(b) What are the two main drawbacks of non-parametric tests?
(4)
(c) Name three general reasons for finding outliers in your data.
(3)
(d) Discuss how you would deal with outliers resulting from any two of the reasons
(5)
mentioned in (c)
SUBTOTAL
75
PAPERTOTALMARKS
100
8