


 |
FDA621S - Forecasting And Data Analysis -2nd Opp - Nov 2025 |
|
|
1 Page 1 |
▲back to top |
nAm I BI Aun IVE RS ITV
OF SCIEnCE Ano TECHnOLOGY
FACULTY OF COMMERCE, HUMAN SCIENCES AND EDUCATION
DEPARTMENT OF MARKETING, LOGISTICS AND SPORT MANAGEMENT
QUALIFICATION: PROCUREMENT & SUPPLY CHAIN MANAGEMENT, LOGISTICS & SUPPLY
CHAIN MANAGEMENT
QUALIFICATION CODE: 07BPSM,
07BLSC
LEVEL: 6
COURSE CODE: FDA621S
COURSE NAME: FORECASTING AND DATA ANALYSIS
SESSION: DECEMBER 2025
PAPER: THEORY
DURATION: 3 HOURS
MARKS: 100
SUPPLEMENTARY/ SECOND OPPORTUNITY EXAMINATION QUESTION PAPER
EXAMINER
MODERATOR
Dr Josua Mwanyekange (FM, PM and DI)
Mr Pius Shifeta (FM and PM Eenhana)
Ms Shinana Paulina
INSTRUCTIONS
1. Answer ALL the questions.
2. Write clearly and neatly.
3. Number the answers clearly.
4. Round of all numerical answers to three (3) decimal places if
possible
THIS QUESTION PAPER CONSISTS OF 6 PAGES (I ncl uding this front page)
|
|
2 Page 2 |
▲back to top |
SECTION A: MULTIPLE CHOICE
[28 Marks]
There are ten multiple-choice questions with seve ral possible choices; choose the best possible
answer, e.g. 1.1 A. Each question is worth two marks.
Question 1
[ 20 marks]
1.1. Which of the following scenarios would most likely benefit from quantitative forecasting
methods?
[2 ma rks]
A. Predicting customer satisfaction levels for a new product
B. Estimating sales for an existing product based on hist orical sales data
C. Deciding on a brand name for a new product
D. Determining employee satisfaction from surveys
1.2. The accuracy of a forecasting model is most commonly evaluated by:
A. The length of time it takes to generate the forecast.
B. The amount of data used in the model
C. The closeness of predicted values to actual outcomes.
D. The statistical significance of the model's coefficients .
[2 marks]
1.3. Which of the following is NOT a common objective of forecasting in business? [2 marks]
A. Cost reduction in supply chain operations
B. Predicting future customer demand
C. Setting future marketing and sales targets
D. Generating random projections to improve decision -making flexibility
1.4. Which type of forecasting method is most appropriate for predicting sales for a new
product where historical data is minimal?
[2 marks]
A. Time-series forecasting
B. Delphi Method
C. Simple Moving Average
D. Linear Regression
1.5. In time-series analysis, what does the "trend" component represent?
[2 marks]
A. Regular patterns that occur at fixed periods, such as monthly or yearly cycles.
B. Unpredictable, random deviations in the data .
C. Long-term directional movement in the data, either upwards or downwards.
D. Fluctuations that happen due to irregular, external factors.
2
|
|
3 Page 3 |
▲back to top |
1.6. The weighted moving average method is typically used when:
[2 marks]
A. You believe more recent observations are more important than older ones.
B. Every observation has the same importance.
C. The data exhibits seasonal variation.
D. There is a constant trend in the data.
1.7. In Exponential Smoothing, what does the smoothing constant (a) represent? [2 marks]
A. The number of data points considered in the calculation.
B. The weight given to the most recent observation .
C. The average of past errors in the forecast.
D. The trend adjustment applied to the forecast.
1.8. What is a major advantage of using Exponential Smoothing over Moving Average
methods?
[2 marks]
A. It is easier to compute and does not require specialized software.
B. It can adjust more quickly to changes in the data .
C. It can handle seasonal data more efficiently.
D. It provides an exact forecast without any error.
1.9. In time series forecasting, the cyclical component refers to:
[2 marks]
A. A pattern that repeats at regular intervals, such as daily or monthly.
B. Long-term, predictable fluctuations due to economic conditions.
C. Short-term fluctuations that are purely random.
D. Repeated fluctuations with irregular timing, often related to business cycles.
1.10. The Mean Absolute Deviation (MAD} is a commonly used metric to evaluate forecasting
models because it:
[2 marks]
A. Measures the average of squared errors.
B. Provides a measure of how much forecast errors deviate from the actual values, in
absolute terms.
C. Measures how well the model fits the data.
D. Predicts future values with high accuracy.
QUESTION 2
[8 marks]
Identify the most appropriate forecasting method for each of the following scenarios and briefly
justify your choice.
a) A new technology product with no past sales data.
3
|
|
4 Page 4 |
▲back to top |
b) A supermarket forecasting weekly demand based on past sales trends.
c) A government panel estimating future GDP growth based on expert opinions.
d) A car rental company forecasting daily vehicle demand using historical booking records.
SECTION B: STRUCTURE QUESTIONS
[72 Marks]
QUESTION 3
[20 marks]
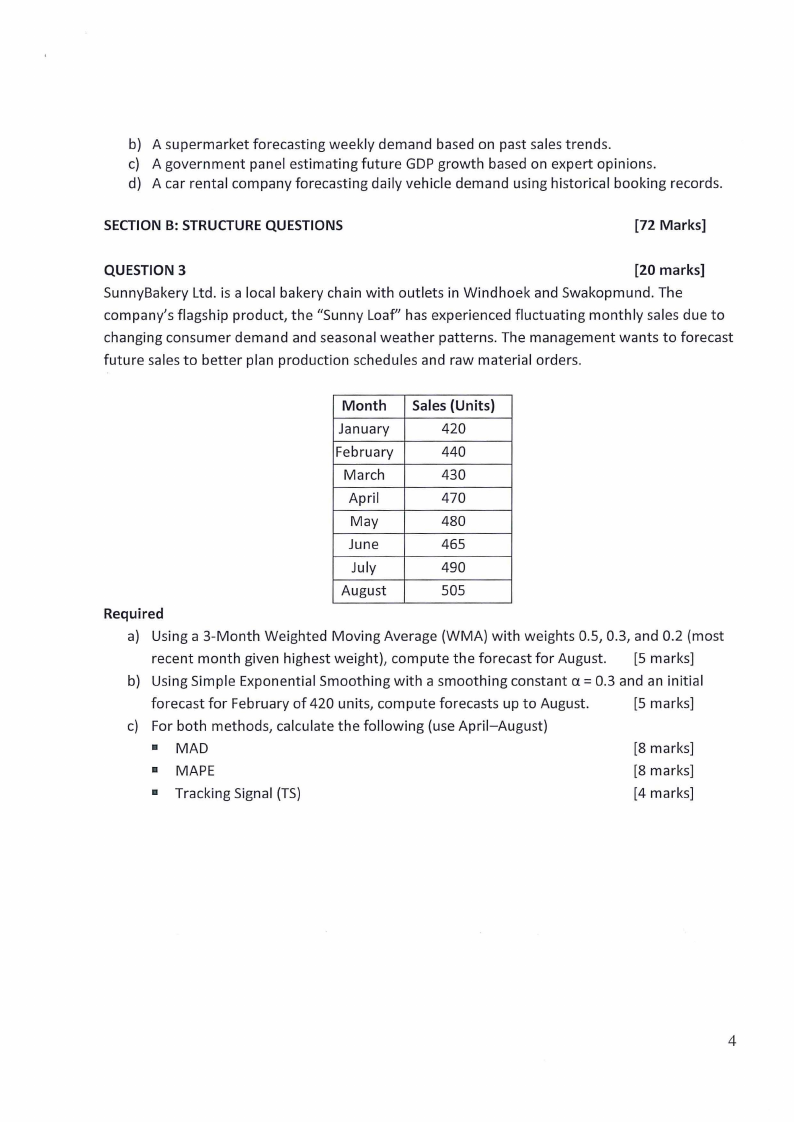
SunnyBakery Ltd. is a local bakery chain with outlets in Windhoek and Swakopmund. The
company's flagship product, the "Sunny Loaf" has experienced fluctuating monthly sales due to
changing consumer demand and seasonal weather patterns. The management wants to forecast
future sales to better plan production schedules and raw material orders.
Month Sales (Units)
January
420
February
440
March
430
April
470
May
480
June
465
July
490
August
505
Required
a) Using a 3-Month Weighted Moving Average (WMA) with weights 0.5, 0.3, and 0.2 (most
recent month given highest weight}, compute the forecast for August. [5 marks]
b) Using Simple Exponential Smoothing with a smoothing constant a= 0.3 and an initial
forecast for February of 420 units, compute forecasts up to August.
[5 marks]
c) For both methods, calculate the following (use April-August)
■ MAD
[8 marks]
■ MAPE
[8 marks]
■ Tracking Signal (TS}
[4 marks]
4
|
|
5 Page 5 |
▲back to top |
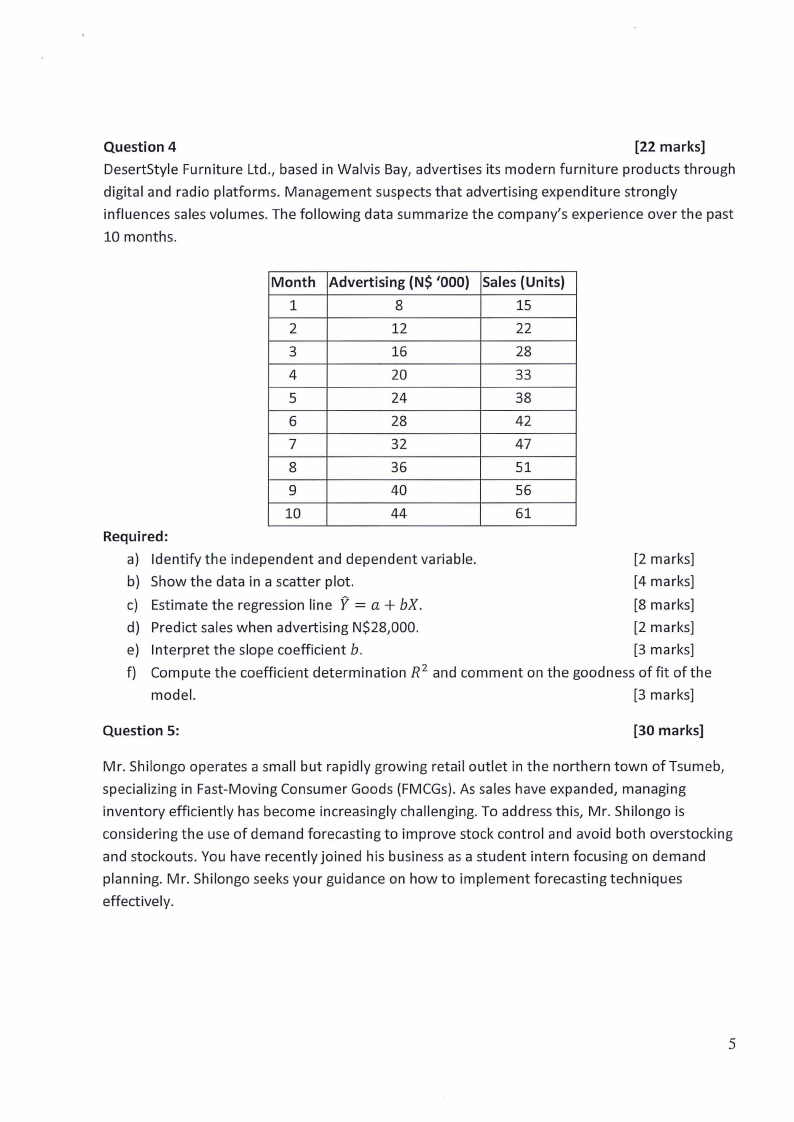
Question 4
[22 marks]
DesertStyle Furniture Ltd ., based in Walvis Bay, advertises its modern furniture products through
digital and radio platforms. Management suspects that advertising expenditure strongly
influences sales volumes. The following data summarize the company's experience over the past
10 months.
Month Advertising (N$ '000) Sales (Units)
1
8
15
2
12
22
3
16
28
4
20
33
5
24
38
6
28
42
7
32
47
8
36
51
9
40
56
10
44
61
Required:
a) Identify the independent and dependent variable.
[2 marks]
b) Show the data in a scatter plot.
= c) Estimate the regression line ? a + bX.
[4 marks]
[8 marks]
d) Predict sales when advertising N$28,000.
[2 marks]
e) Interpret the slope coefficient b.
[3 marks]
f) Compute the coefficient determination R 2 and comment on the goodness of fit of the
model.
[3 marks]
Question 5:
[30 marks]
Mr. Shilongo operates a small but rapidly growing retail outlet in the northern town of Tsumeb,
specializing in Fast-Moving Consumer Goods {FMCGs). As sales have expanded, managing
inventory efficiently has become increasingly challenging. To address this, Mr. Shilongo is
considering the use of demand forecasting to improve stock control and avoid both overstocking
and stockouts. You have recently joined his business as a student intern focusing on demand
planning. Mr. Shilongo seeks your guidance on how to implement forecasting techniques
effectively.
5
|
|
6 Page 6 |
▲back to top |
Required:
a) Explain to Mr. Shilongo the importance of demand forecasting for his FMCG retail business.
[6 marks]
b) Using practical examples, outline and describe a systematic demand forecasting process that
Mr. Shilongo can adopt, clearly explaining each major step involved.
[20 marks]
c) Recommend and justify the most suitable forecasting method(s) for Mr. Shilongo's business,
considering the nature of FMCG demand and data availability.
[4 marks]
=================================END======================================
6