BBS112S - BASIC BUSINESS STATISTICS 1B - 1ST OPP - NOVEMBER 2024


BBS112S - BASIC BUSINESS STATISTICS 1B - 1ST OPP - NOVEMBER 2024


1 Page 1

▲back to top


nAmlBIA unlVERSITY
OF SCIEnCEAnDTECHnOLOGY
FacultoyfHealthN, atural
ResourcaensdApplied
Sciences
Schoool f NaturalandApplied
Sciences
Departmentof Mathematics,
StatisticsandActuarialScience
r
13JacksonKaujeuaStreet
PrivateBag13388
Windhoek
NAMIBIA
T: +26461207 2913
E: msas@nust.na
W: www.nust.na
QUALIFICATIONS: B. Business Ad min, B. Marketing, B. Human Resource Management, B.
Public Management and B. Logistics and Supply Chain Management
QUALIFICATIONCODE: 21BBAD / 07BMAR / 07BHR /
24BPN / 07BLSM
LEVEL:6
COURSE:BASIC BUSINESS STATISTICS lB
DATE: NOVEMBER 2024
COURSECODE: BBS112S
SESSION: 1
DURATION: 3 HOURS
MARKS: 100
FIRST OPPORTUNITY: EXAMINATION QUESTION PAPER
EXAMINERS:
MR E. MWAHI, MRS. KASHIHALWA, DR. J. MWANYEKANGE,
MS A. SAKARIA, MS. N. PONHOYOMWENE, MS L. KHOA
MODERATOR: MR J. SWARTZ
INSTRUCTIONS:
1. Answer all questions on the separate answer sheet.
2. Please write neatly and legibly.
3. Do not use the left side margin of the exam paper. This must be allowed for the examiner.
4. No books, notes and other additional aids are allowed.
5. Mark all answers clearly with their respective question numbers.
PERMISSIBLE MATERIALS:
1. Non-Programmable Calculator
ATTACHEMENTS:
1. T- Table
2. Normal distribution table
3. Chi-square table
This paper consists of 6 pages including this front page.

2 Page 2

▲back to top


QUESTION1
[20 MARKS)
Write down the letter corresponding to the best answer for each question.
1.1 A NUST mathematics lecturer is interested in the average number of days Engineering
Mathematics students are absent from class during a semester.
1.1.1 What is the population he is interested in?
[2]
A. All NUST students
B. All NUST English students
C. All NUST students in his classes
D. All NUST Engineering Mathematics students
1.1.2 Consider the following: X = number of days a NUST Engineering Mathematics
student is absent. In this case, Xis an example of a:
[2]
A. Variable
B. Population
C. Statistic
D. Data
1.1.3 The lecturer takes his sample by gathering data on five randomly selected
students from each NUST Engineering Mathematics class. The type of
sampling he used is
[2]
A. Cluster sampling
B. Stratified sampling
C. Simple random sampling
D. Convenience sampling
1.1.4 The lecturer's sample produces an average number of days absent of 3.5
days. This value is an example of a
[2]
A. Parameter
B. Data
C. Statistic
D. Variable
1.2 According to the data reported by Namib Poultry regarding Bird flu for the years 2000-
2004, the least squares line equation for the number of reported dead birds (x) versus
the number of Bird flu cases (y) is y = -10.2638 + 0.0491x. If the number of dead
birds reported in a year is 732, how many Bird flu cases can be expected?
[2]
A. 25.7
B. 46.2
C. -25.7
D. 7513
BASICBUSINESSSTATISTICSlB
1st opportunity November 2024
2

3 Page 3

▲back to top


1.3 When a new drug is created, the pharmaceutical company must subject it to testing
before receiving the necessary permission from the Food and Drug Administration
{FDA) to market the drug. Suppose the null hypothesis is "the drug is unsafe." What
is the Type II Error?
[2]
A. To conclude the drug is safe when in, fact, it is unsafe
B. To not conclude the drug is safe when, in fact, it is safe.
C. To conclude the drug is unsafe when, in fact, it is safe.
D. To not conclude the drug is unsafe when, in fact, it is unsafe
1.4 Previously, an organization reported that teenagers spent 4.5 hours per week, on
average, on the phone. The organization thinks that, currently, the mean is higher.
Fifteen (15) randomly chosen teenagers were asked how many hours per week they
spend on the phone. The sample mean was 4.75 hours with a sample standard
deviation of 2.0. Conduct a hypothesis test.
1.4.1 The null and alternate hypotheses are:
[2]
-
A. H 0 :x:;4.5
C. H 0 :µ:; 4.75
1.4.2 At a significance level of alpha= 0.05, what is the correct conclusion?
[2]
A. There is enough evidence to conclude that the mean number of hours is
more than 4.75
B. There is enough evidence to conclude that the mean number of hours is
more than 4.5
C. There is not enough evidence to conclude that the mean number of hours is
more than 4.5
D. There is not enough evidence to conclude that the mean number of hours
is more than 4.75
BASICBUSINESSSTATISTICS18
1st opportunity November 2024
3

4 Page 4

▲back to top


1.5 In a simple random survey of 89 teachers at high school AP Statistics, 73 said
that it was the most satisfying, most enjoyable course they had ever taught.
Establish a 98% confidence interval estimate of the proportion of all high school
AP Statistics teachers who feel this way.
[2]
A. 0.820 ± .004
B. 0.820 ± .041
C 0.820 ± .084
D. 0.820 ± .095
1.6 An inspector needs to learn if customers are getting fewer ounces of a soft drink than
the 28 ounces stated on the label. After she collects data from a sample of bottles, she
is going to conduct a test of a hypothesis. She should use
[2]
A. a two tailed test.
B. a one tailed test with an alternative to the right.
C. a one tailed test with an alternative to the left.
D. either a one or a two tailed test because they are equivalent
QUESTION 2
[31 MARKS]
2.1 An advertising agency that serves a major radio station wants to estimate the mean
amount of time that the station's audiences spend listening to the radio daily. The
agency wanted to be 95.76% confident of being correct within+ or- 5 minutes. If the
sample size needed was 220 audiences, estimate the standard deviation used. [4]
2.2 A polling firm samples 600 likely voters and asks them whether they favour a proposal
involving school bonds. A total of 330 of these voters indicate that they favour the
proposal. Estimate the true population proportion of voters who do not favour the
proposal with a 92.5% level of confidence.
[6]
2.3 Twenty-five Smart Cars were randomly selected in Windhoek and the highway speed
of each was noted. The analysis yielded a mean of 45 kilometres per hour and a
standard deviation of 5 kilometres. Find and interpret a 90% confidence interval for
the average highway speed of all Smart Cars in Windhoek.
[6]
2.4 Samples of a high temperature lubricant were tested and the temperature (0 C) at
which they ceased to be effective were as follows:
235 242 235 240 237 234 239 237
BASICBUSINESSSTATISTICS1B
istopportunity November 2024
4

5 Page 5

▲back to top


Assuming that temperature is normally distributed, calculate a 95% confidence
interval estimate for the population variance.
[10]
2.5 Suppose a mobile phone company wants to determine the current percentage of
customers aged 50+ that use text messaging on their cell phone. How many customers
aged 50+ should the company survey to be 90% confident that the estimated sample
proportion is within 3 percentage points of the true population proportion of
customers aged 50+ that use text messaging on their cell phone.
[5]
QUESTION 3
[20 MARKS]
3.1 Suppose that a recent article stated that the mean time spent in jail by a first-time
convicted burglar is 2.5 years. A study was then done to see if the mean time has
increased in the new century. A random sample of 26 first-time convicted burglars in
a recent year was picked. The mean length of time in jail from the survey was 3 years
with a standard deviation of 1.8 years. Suppose that it is somehow known that the
population standard deviation is 1.5. At 5% level of significance, conduct a hypothesis
test to determine if the mean length of jail time has increased. The distribution of the
population is normal.
[8]
3.2 In a recent survey, 140 members were randomly interviewed at a gym and asked to
indicate their most preferred gym activity. The choices were spinning, swimming or
circuit. The gender of the member was also noted. Their summarised responses are
shown in the cross-tabulation table below.
Gender
Most preferred activity
Spinning
Swimming
Circuit
Male
36
19
30
Female
29
16
10
Is there a statistical association between most preferred gym activity and gender? Test at the
10% level of significance.
[12]
BASICBUSINESSSTATISTICSlB
l51Opportunity November 2024
5

6 Page 6

▲back to top


QUESTION 4
[29 MARKS]
4.1 A cycle shop recorded the quarterly sales of racing bicycles for the period 2009 to
2011, as shown in Table below.
Year
Period
Sales
2009
2010
2011
Ql Q2 Q3 Q4 Ql Q2 Q3 Q4 Ql Q2 Q3 Q4
17 13 15 19 17 19 22 14 20 23 19 20
4.1.1 Produce a four-period centred moving average for the quarterly sales of racing
bicycles sold by the cycle shop during the period 2009 to 2011.
[8]
4.1.2 Compute the estimated straight line trend equation {Y =a+ bX) by the method of
least squares using the sequential coding method, start the coding from 0
[10]
4.1.3 Estimate the bicycles sales for Ql of 2007 and Q4 of 2012.
[4]
4.2 A motorcycle dealer has recorded the unit prices and quantities sold of three models
of the Suzuki motorcycle for 2009 and 2010. The quantities sold and unit selling prices
for both these years are given in the following table:
Motorcycle
model
A
B
C
2009
Price {N$)
Quantity
25
10
15
55
12
32
2010
Price {N$)
Quantity
30
7
19
58
14
40
4.2.1 Find the price relative for each motorcycle model. Use 2009 as the base
period.
[3]
4.2.2 Calculate the composite price index for 2010 with 2009 as the base period
using the Laspeyres weighted aggregates method.
[4]
BASICBUSINESSSTATISTICS1B
1st opportunity November 2024
6

7 Page 7

▲back to top


,e.g., for;: = - 1.34, refer to the ..:.1.3
row and the 0.04 c,ilunrn to
find the cumulative nrcn, 0.090 I.
L
j
The Standard Normal Distribution
z
0
z
0.00
0.01
0.02
0.03
0.04
0.05
0.06
0.07
0.08
0.09
-3.0 0.0013 0.0013 0.0013 0.0012 0.0012 0.0011 0.0011 0.0011 0.0010 0.0010
-2.9 0.0019 0.0018 0.0018 0.0017 0.0016 0.0016 0.0015 0.0015 0.0014 0.0014
-2.8 0.0026 0.0025 0.0024 0.0023 0.0023 0.0022 0.0021 0.0021 0.0020 0.0019
-2.7 0.0035 0.0034 0.0033 0.0032 0.0031 0.0030 0.0029 0.0028 0.0027 0.0026
-2.6 0.0047 0.0045 0.0044 0.0043 0.0041 0.0040 0.0039 0.0038 0.0037 0.0036
-2.5 0.0062 0.0060 0.0059 0.0057 0.0055 0.0054 0.0052 0.0051 0.0049 0.0048
-2.4 0.0082 0.0080 0.0078 0.0075 0.0073 0.0071 0.0069 0.0068 0.0066 0.0064
-2.3 0.0107 0.0104 0.0102 0.0099 0.0096 0.0094 0.0091 0.0089 0.0087 0.0084
-2.2 0.0139 0.0136 0.0132 0.0129 0.0125 0.0122 0.0119 0.0116 0.0113 0.0110
-2.1 0.0179 0.0174 0.0170 0.0166 0.0162 0.0158 0.0154 0.0150 0.0146 0.0143
w
-2.0 0.0228 0.0222 0.0217 0.0212 0.0207 0.0202 0.0197 0.0192 0.0188 0.0183
-1.9 0.0287 0.0281 0.0274 0.0268 0.0262 0.0256 0.0250 0.0244 0.0239 0.0233
-1.8 0.0359 0.0351 0.0344 0.0336 0.0329 0.0322 0.0314 0.0307 0.0301 0.0294
-1.7 0.0446 0.0436 0.0427 0.0418 0.0409 0.0401 0.0392 0.0384 0.0375 0.0367
-1.6 0.0548 0.0537 0.0526 0.0516 0.0505 0.0495 0.0485 0.0475 0.0465 0.0455
-1.5 0.0668 0.0655 0.0643 0.0630 0.0618 0.0606 0.0594 0.0582 0.0571 0.0559
-1.4 0.0808 0.0793 0.0778 0.0764 0.0749 0.0735 0.0721 0.0708 0.0694 0.0681
-1.3 0.0968 0.0951 0.0934 0.0918 0.0901 0.0885 0.0869 0.0853 0.0838 0.0823
-1.2 0.1151 0.1131 0.1112 0.1093 0.1075 0.1056 0.1038 0.1020 0.1003 0.0985
-1.1 0.1357 0.1335 0.1314 0.1292 0.1271 0.1251 0.1230 0.1210 0.1190 0.1170
-1.0 0.1587 0.1562 0.1539 0.1515 0.1492 0.1469 0.1446 0.1423 0.1401 0.1379
-0.9 0.1841 0.1814 0.1788 0.1762 0.1736 0.1711 0.1685 0.1660 0.1635 0.1611
-0.8 0.2119 0.2090 0.2061 0.2033 0.2005 0.1977 0.1949 0.1922 0.1894 0.1867
-0.7 0.2420 0.2389 0.2358 0.2327 0.2296 0.2266 0.2236 0.2206 0.2177 0.2148
-0.6 0.2743 0.2709 0.2676 0.2643 0.2611 0.2578 0.2546 0.2514 0.2483 0.2451
-0.5 0.3085 0.3050 0.3015 0.2981 0.2946 0.2912 0.2877 0.2843 0.2810 0.2776
-0.4 0.3446 0.3409 0.3372 0.3336 0.3300 0.3264 0.3228 0.3192 0.3156 0.3121
-0.3 0.3821 0.3783 0.3745 0.3707 0.3669 0.3632 0.3594 0.3557 0.3520 0.3483
-0.2 0.4207 0.4168 0.4129 0.4090 0.4052 0.4013 0.3974 0.3936 0.3897 0.3859
-0.1 0.4602 0.4562 0.4522 0.4483 0.4443 0.4404 0.4364 0.4325 0.4286 0.4247
-0.0 0.5000 0.4960 0.4920 0.4880 0.4840 0.4801 0.4761 0.4721 0.4681 0.4641
Source:Cumulative standard normal probabilities generated by M,nitab, then rounded to four decimal places.
I 5217X_IBC.indd 1
I 0410211o a:sJPM

8 Page 8

▲back to top


e.g., for z = 1.34. refer to the '
1.3 row and the 0.04 column to
find the cumulative area, 0.9099.
!
The Standard Normal Distribution
0
z
z
0.00
0.01
0.02
0.03
0.04
0.05
0.06
0.07
0.08
0.09
0.0
0.5000 0.5040 0.5080 0.5120 0.5160 0.5199 0.5239 0.5279 0.5319 0.5359
0.1
0.5398 0.5438 0.5478 0.5517 0.5557 0.5596 0.5636 0.5675 0.5714 0.5753
0.2
0.5793 0.5832 0.5871 0.5910 0.5948 0.5987 0.6026 0.6064 0.6103 0.6141
0.3
0.6179 0.6217 0.6255 0.6293 0.6331 0.6368 0.6406 0.6443 0.6480 0.6517
0.4
0.6554 0.6591 0.6628 0.6664 0.6700 0.6736 0.6772 0.6808 0.6844 0.6879
0.5
0.6915 0.6950 0.6985 0.7019 0.7054 0.7088 0.7123 0.7157 0.7190 0.7224
0.6
0.7257 0.7291 0.7324 0.7357 0.7389 0.7422 0.7454 0.7486 0.7517 0.7549
0.7
0.7580 0.7611 0.7642 0.7673 0.7704 0.7734 0.7764 0.7794 0.7823 0.7852
0.8
0.7881 0.7910 0.7939 0.7967 0.7995 0.8023 0.8051 0.8078 0.8106 0.8133
0.9
0.8159 0.8186 0.8212 0.8238 0.8264 0.8289 0.8315 0.8340 0.8365 0.8389
1.0 0.8413 0.8438 0.8461 0.8485 0.8508 0.8531 0.8554 0.8577 0.8599 0.8621
?i}
1.1 0.8643 0.8665 0.8686 0.8708 0.8729 0.8749 0.8770 0.8790 0.8810 0.8830
1.2 0.8849 0.8869 0.8888 0.8907 0.8925 0.8944 0.8962 0.8980 0.8997 0.9015
1.3 0.9032 0.9049 0.9066 0.9082 0.9099 0.9115 0.9131 0.9147 0.9162 0.9177
1.4 0.9192 0.9207 0.9222 0.9236 0.9251 0.9265 0.9279 0.9292 0.9306 0.9319
1.5 0.9332 0.9345 0.9357 0.9370 0.9382 0.9394 0.9406 0.9418 0.9429 0.9441
1.6 0.9452 0.9463 0.9474 0.9484 0.9495 0.9505 0.9515 0.9525 0.9535 0.9545
1.7 0.9554 0.9564 0.9573 0.9582 0.9591 0.9599 0.9608 0.9616 0.9625 0.9633
1.8 0.9641 0.9649 0.9656 0.9664 0.9671 0.9678 0.9686 0.9693 0.9699 0.9706
1.9 0.9713 0.9719 0.9726 0.9732 0.9738 0.9744 0.9750 0.9756 0.9761 0.9767
2.0
0.9772 0.9778 0.9783 0.9788 0.9793 0.9798 0.9803 0.9808 0.9812 0.9817
2.1
0.9821 0.9826 0.9830 0.9834 0.9838 0.9842 0.9846 0.9850 0.9854 0.9857
2.2
0.9861 0.9864 0.9868 0.9871 0.9875 0.9878 0.9881 0.9884 0.9887 0.9890
2.3
0.9893 0.9896 0.9898 0.9901 0.9904 0.9906 0.9909 0.9911 0.9913 0.9916
2.4
0.9918 0.9920 0.9922 0.9925 0.9927 0.9929 0.9931 0.9932 0.9934 0.9936
2.5
0.9938 0.9940 0.9941 0.9943 0.9945 0.9946 0.9948 0.9949 0.9951 0.9952
2.6
0.9953 0.9955 0.9956 0.9957 0.9959 0.9960 0.9961 0.9962 0.9963 0.9964
2.7
0.9965 0.9966 0.9967 0.9968 0.9969 0.9970 0.9971 0.9972 0.9973 0.9974
2.8
0.9974 0.9975 0.9976 0.9977 0.9977 0.9978 0.9979 0.9979 0.9980 0.9981
2.9
0.9981 0.9982 0.9982 0.9983 0.9984 0.9984 0.9985 0.9985 0.9986 0.9986
3.0
0.9987 0.9987 0.9987 0.9988 0.9988 0.9989 0.9989 0.9989 0.9990 0.9990
5217X_IBC.lndd 2
I 04/02110 8:53 PM

9 Page 9

▲back to top


APPENDIX E: The Chi-Square Distribution
i Ii I ii I .990 I .975 ii .950 1···:900-.7-50
i .500 " .250 II .100
.050
.025 Ii .010
.005
lo.00016 ilo.00098__jjo.00393_ llo.01579 iio.10153 1:!_o.45494 lj1.32330 i!2.70554 i_.13.84146115.02389 ii6.63490 7.87944
1
:t==::i====i·:i=lo=.0=2=0=10=tii@~aso64---1io.10215190:21072· 110.57536 iT1.38629 112.77259 !14.60517 115.99146 1_17.377761·19.21034 10.59663
!I_~::?.~~-- jo.11483 ilo.21580 ilo.35185 l!o.s8437 ii1.21253 !12.36597
IJ6.25139 :j7.81473 119.34840 !j11.34487 12.83816
i!:::~~~= !0.29111 ilo.48442 lfo~10?·2-Jl1:?.6362 !!1.92256
:!5.38527 !17.77944 lj9.48773 li11.14329 !Jl3.27670 14.86026
io.s5430 ilo.83121 !l1.14548 111.61031Jj2.6746o !!4.35146 [6.62568 1:9.23636 i 11.01050 ih2.8325o 1~115.0862116.74960
•i===::t1"1=0.=87=2=0=9=i1i1.23i7~3i;4~~:;~--1[3.;~;~~
r 11~:34812 [7.84080 ;110.64464 12.59159ii14.449381116.81189 18.54758
11.23904 :11.68987 ii2.16735 li2.83311 [[4:2·s4s·s···-r16.34581U9.03715 !112.01704[\\14.06714 jl16.01276 [118.47531 20.27774
I ::=s=,:::1=.3=444::=:u=.1:11=.6=4=26.=15709=7:3[ li2.-73264___j3_._48954 !l5.07064 117.34412 ii10.21885 ii13.36157 15.50731 ij11.53455 l\\20.09024 21.95495
IJ~:1.6.~1.6. 9 1.73493 j2.08790 '2.10039 11~:~~?.1.1.
jj5.89883 !'!8.34283 hi.38875 !!14.68366 jj16.91898 il19.02277 !121.66599 23.58935
10 h.15586 12.55821 ,13.24697 !13.94030 d4.86518 !!6.73720 119.34182 1112.54886ii15.98718lrn.307041120.48318 i\\23.20925 25.18818
:=~t"ii2.60322 113.05348 !13.81575 1~15.57778
!i3.07382 !3.57057 /14.40379
i:i7.?.~~1.~jho.34100 <i13.70069i11.215011119.675141121.92005 il24.72497 26.75685
i i!8.43842 iJll.34032 J4.84540 18.54935 ib1.02607 !lz3.33666 lj26.21697 28.29952
ii3.56503 J4.10692 115.00875 11~:~?1.~6 )?.:?~1.~o i 9.29907 lh~-33976 !15.98391 j 19.811931!22.36203ll24.735601127.68825 29.81947
-l I !i4.07467 /4.66043 115.62873 i 6.57063 117.78953 10.16531 1113.33927 117.11693 21.06414jj23.684791126.11895 il29.14124 31.31935
if I _:_:~.Ji4.60092 li5.22935 j 6.26214 jj1.26094 jj8.54676 , 11.03654 1[1.4.33886 1S:24-so_9_li22.3o713 !24_99579!27.48839 30.57791 32.80132
l I l!5_14221 115.81221 i 6.90766 I17.96165 119.31224 II11.91222 !j15.3385o 19.36886 123.54183 I 26.29623 j !28.84535 IJ3L99993 !34.26719
1
1!5.69722 16.40776 ll7.56419 li8.67176 !110.08519 ii12.79193 fl16.33818 ![20.48868 !!24.76904i\\27.587111130.191011133.40866 ! 35.71847
6.26480 111.01491 il8.23075 li9.39046 IF?:~~;?~_Jjn67529 IJ17.3379o [!21.60489 jj25.98942 il28.8693o 1131.52638jj34.80531 J 37.15645
2 i 11 6.84397 .63273 8.90652 iE·?:~-~??~]in.65091] 4.562001118.33765 :b2.71781 ii21.203571]30.14353 jb2.85233 il36.19087 i 38.58226
7.43384 18.26040 ! 9.59078 jjio.85081jj12.44261 !i15.45177 iJ19.33743 !h3.82769 il28.411981131.41043 jl34.16961 1!37.566231!39.99685
i 21 :8.03365 18.89720 10.28290 !111.59131~13.23960 il16.34438!j20.33723 li24_93478 li29.615o9 32.67057 j!35.47888 !138.932111141.40106
i ;;8.64272 j9.54249 10.98232 ··~;:~;~~rril4.04149 i 17.23962 i[~l.33704 il26.03927 ll30.81328 !133.92444!136.78071i!40.28936 1142.79565
9.26042 !10.19572 ;_11.68855 [13_090511114.84796118.137301122.33688 !!21.14134 i!32.00690 il35.17246 lb8.075631\\4L6384o !144.18128
I 9.88623 j10.85636 l\\12.40115 113.84843 jl15.65868 19.03725 Jl23.33673 ll28.24115 il33.196241136.415031139.364081142.97982!145.55851
10.519651[11.52398113.11972 14.6-U41IJ16.47341 19.93934 ii24.33659 1129.33885li34.38159137.652481140.64647 1144.31410I 46.92789
I I 11.16024 J12.19815 13.84390 115.379161!17.291881 o.84343 t!25.33646 !30.43457 ib5.56317 l,38.885141141.92311 !145.64168 48.28988
i 11.80759 112.87850 14.57338 !il6.1514~ri~~-~~390 i 1.74940 li26.33634 !31.52841 1136.74122il40.11327 li43.19451 !. 1146.96294!!49.64492
I 12.46134 113.56471i ~~:~;;~~iilli9278811~~:~-3~~~ ~2.65716 !!27.33623 il32.62049 1137.91592il41.337141!44.46079 :148.27824 ::50.99338
i 13.12115 !14.25645 l16.047071_17.70837 l\\1?.76774 23.56659 28.33613 .133.71091 !139.08747il42.55697 li45.72229 il49.58788 i!52.33562
,I 199.~~ 14.95346 !J~?:!~???JE~:49~G~J!:?~5.9.923 : 24.47761 [[29.33603 j134. Ji40.25502 ll43.77297 1146.97924li5o.89-:.:~!i_5.~:6_~~9.6

10 Page 10

▲back to top


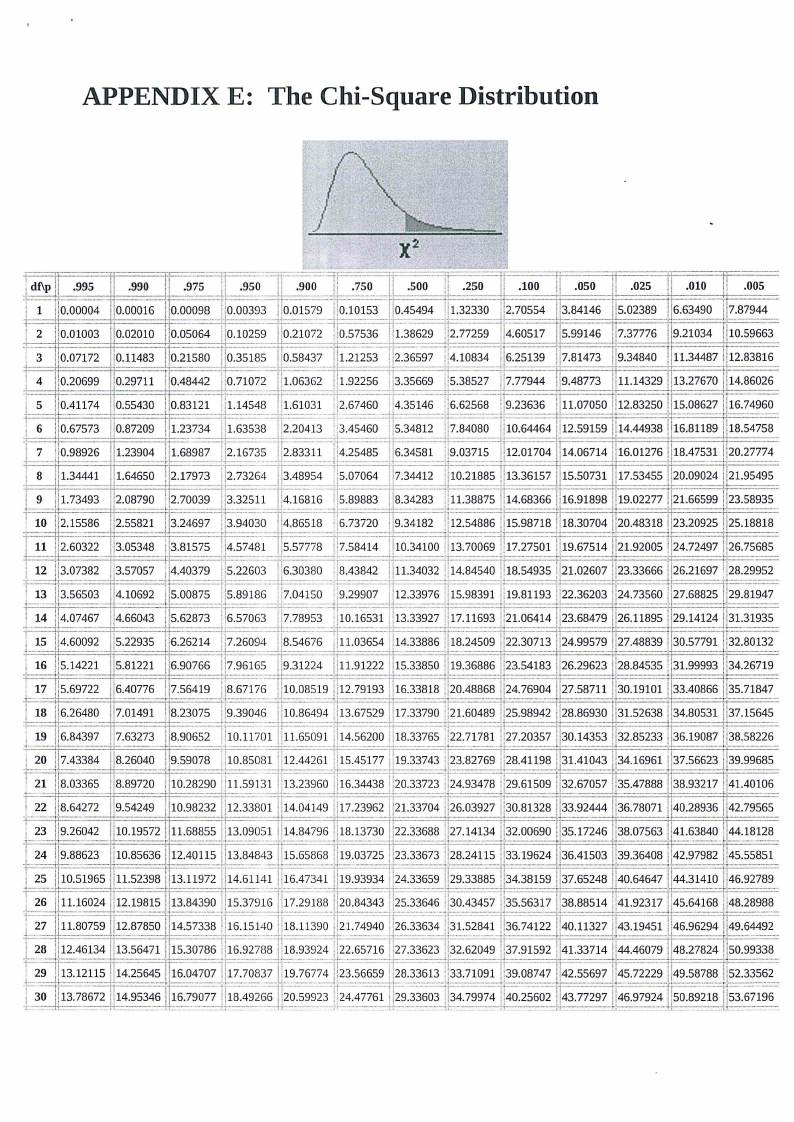
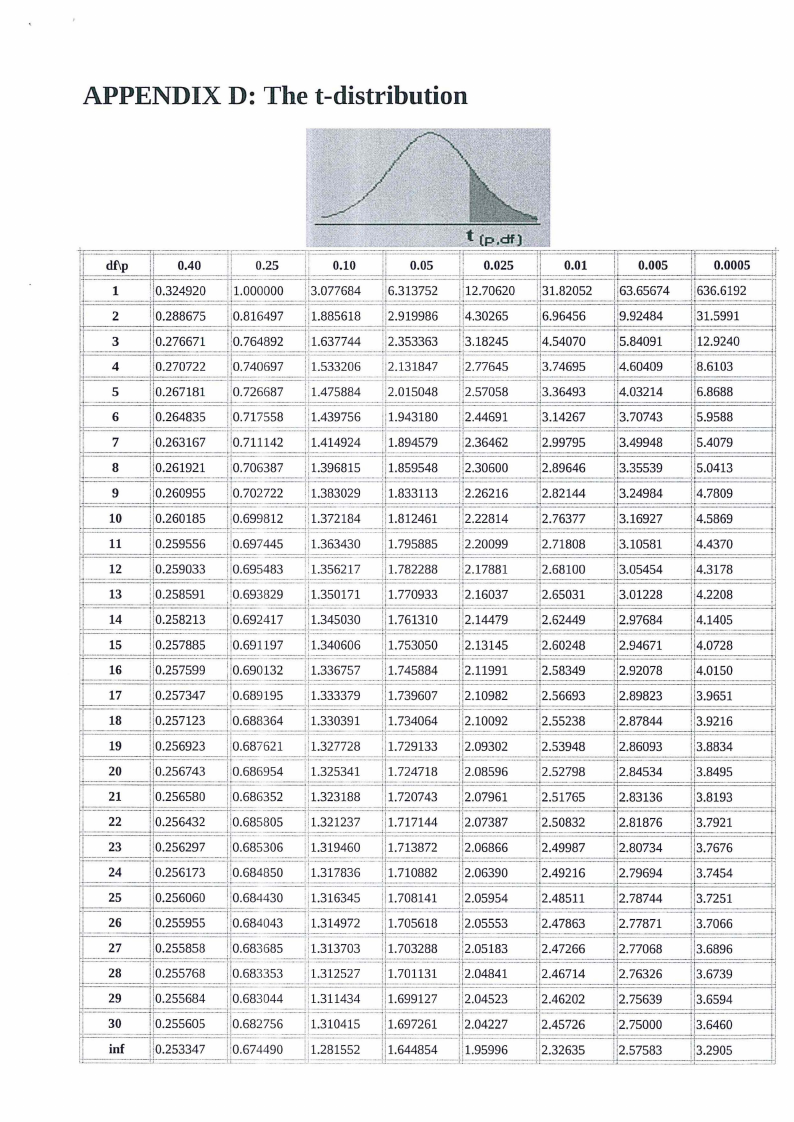
APPENDIX D: The t-distribution
;.;===::=;:i::::====r:,-
··-=-=-=-~=,~~~; ~~~~F~~~~===;:;::===:::;:;::::====ci.
>+-::::=d=f\\=p==n!i==o=.4=0=~=-+-='·2'·=-=.5=n''==o=.1=o==n==o=.0=5· ,_, _=o=.0=2=5=::r!l:==o=.0=1==::o::=il.:0t:=I0=5==t==o.=0=00=5=:::
,,_ 1
i] !10.324920 111.000000 1!3.077684 !i6.313752 JG:2.70620 !\\31.82052 1163.65674 1!636.6192
li:==2=:=ti::::lo=.2=8=86=7i=.:5==o:.+=i8i.=1=6i=t:4:i=19==.87=85=6=1=8=:tt====:::j1't=14=_3=0=26=5==ii6.96!.4j95.692484
:t::::::===n=====.':t====::::;'t::'
====1t====::::;:=====:1::t=!
====rt::====:·::::·
i131.5991 !1
===:::t1jl
3 ilo.276671 ! o.764=89=2=:::;:i:=:i1=.6=3=77=4=4=:::=======1l+.:i31==·41.==85==244o==57===o=+=l=+!i:l5=.8=4=o=91=::::::1::;!
1
4 llo.21012~10.140597
111.533206 li2.131847 112.11645 113.74695 il4.6o4o9 1!8.6103 !I
!i
•·
~====i,i=. ====,t=. ====i:,t.=====.,t.
====:::t1,j
t:==5==i:q=o.=2=67=1=8=1=+i::i0=.1=2=6=68=7=::::i!:t::11=.4=7=53=3=4=::;.:l!=2.=0=15=0=43=::::iilt::~=:?=~o=·-5=~-=---=·•·
6 jjo.264835
i!i.439756 111.943180 ib.44691 113.14261 113.10143 ::5.9588
i]
7 110.263167
a Jlo.251921
iil.414924 ;ll.894579- -- b.36462
!b.99795 113.49948 115.4079 !.1.' ...
11.396815 I 1.859548 ii2.3o6oo !12.89646 113.35539 ll5.0413
9
.:i.383029 t 1.833113 112.26216 l;::i2=.8=2=14=4==+1t13=_=24=9=8=4==i)i=4
t==1=0=::::iilo.260185
11 110.259556
!11.372184 '1.812461 12.22814 112.76377 !13.16927 ib.5869
ij
I1;:::::'i=.3=..6.:.:_3.::_:=.i.4:.t~.=..:.3:::::1:7--.9:0=_-:5::=:8=85==1!:::=21=2.7.21=800=809=9=i:=3;.10581 I!4.4370
!]
t:i===1==2:::::l;::io=.2=5=9=i0''=--3--=·3 _::P1.355211
1.782288 i 2.17881 i;::::i2=.6=8=10=o===tj•ht=.=05=4=5=4==1j'·+
13 110.258591 'lo.693829 1,350111 1.110933 2.16037 :12.65031 113.01228 Jj4_2208 ,1
t==1=4=::::t1io.258213
24''1'·,',",,1,,'',:,,.:.:,.3.,,t,.,41,,:5::::·.:0"·37·=·•6:=:o1,3.·=,,1,,=,,0,,=,,,:.i,t.2·.=,·_.,=tt1=:4:i1=4=b=.=7.=69=244=9===",·',2=.==9::7:j=16'·=18===4:4=.1=4=05=
15 iio.257885
==::;:::::1=.3=40=6=06:::::::,,::,:=1=.1=5=30=5=0=::t2=--:·=;:3=--1=4=s--=---=--:::::--l:=i2=.6=0=2
1===1=6==1lo.257599 ;Io.690=13=2==+=1=.3=3=67=5=47==5:=::8t=,i:8=41=.==7t1=2=.1=1!=29.5=89314=9==ij I!2.92078 I14.o150
Jj
t=::::=11===+t:1:lo=.2=57=3=lo4.=618=9i1·=9=5===,t=:1.=:3==:3;:3:1==3.=7::-9-=
13=.9=6=5=1
==1=8 :+=!i
i 1=7.=3=40=6=4==l=2.=10=0=9=2=::::±jh.sI!522.8373844 13.9216
ij
19 110.256923 110.687621 ill.327728
i: :;:::::::=20==1,;==10=.2=56=7=4=3::::::==1.t3i 25341
:i{~;-;;~33 2.09302 ::2.s3948
l=l=i7. =24=7=1=8=:iti2=.==0=8==i=ii25.-5--2=799=86
112.86093 i'i3.8834
11
1·t=12=.8=4=513=34.===8=4i=19t =5====
1
i::=::!2·=t=1i=======:::i',:o:.2:5=6=5:8:o:::·:..~..',=.,~{-:.=6;,=,,.2,.38=-·,.~,G=~_3·=_~5=_-:~2=_-~_:-::;::::{-=.;=;o=··-7=4=3==1ii:::::::2=.0=79=5=1==+i:;_i;:::2==.5
ii=' =2=2=::::::t0l:=I.2=5=6=43=2=:=5i8~0·:5:c::::d:.321237 lil.717144 !l:::::2=.0=73=8=7=::::::i-tl!2=.=50=8=3=2==ii±:12::::.8=1=8
23 110.256297 -· ____··---------·-!;.=il=.=3=:-1::91=!!41=.151=30872 !!2.06866 ib.49987 il2.8o734 113.7676
·+=·=------·=-j·=20=.4==2·5·=-=6·=··1·7··=·3·==·:·:·:·:-r-,=rl:+l 1.317836 i==7l==1.0=8=8=21=2:=t_!t=06=3==9i!=l20.49216 j!2.79694
3.7454
!]
25 Ij0.256060
.'1::1.~=~-~·--i:.:---:1.::::70=8=1=41===!t=1i2==2..0==45==8955==14=1=12==7:1::=::1::8.:jt=ll7==44==il7==32=5.=1==::::;:11
µ::[I==26=:::::::::;:i!==io·=:-:-::2:=::5::5ji=.E94=?5_=_4_53 :F:1=.3=14=9=7=2=+:~i=l.=70=5=6=18==ii,,=i2=.0=5=55=3=::::::;:ill::::2.=4=78=6=3==i
1
i:t:==2=1== 0!!0.255858 !io.683685 dl.313703 111.103288 ::2.05133 2.47266 !12.11068 13.6896
!.'1....
~.=;:=: 2B===ti1==lo=.2=55=7=G8==!!J_~~--~-~-3~-5t=·l'l·\\,i,7ll·1o.l31132152;-·[[2.04341 1!2.46714 ib.76326
3.6739
11
i! 29 i!o.255684 'lo.683044 I 1.311434 ii1.699121 !!2.04523 112.45202 112.75639 3.6594
i.•.J..
i3i tt:::==3=0=1
.'+=.11·. 0=.2=5=56=0=5=::t:7l.~=6o_=.6i=· 8=20415
1
!. l.1.697261 !,!.2.04221
I'2.45726
!., !.27. 5000
1i:i3.6460
!•.
r+==in=f===1+10=.2=5=33=4=74=4:9:;0:-;i-=j;o==l..=62=87=1=55=2=11--.6l -4-4854-!j:::::l=.9=59=9j=26==.3==121=+6=35===i1i=12=.5=7=58=3===;:;11=
tt::::::====i:'i::=::=:' ···-··::...
- -H---::=.,-
.. =·::='.'.::::=..-.:=:.::.,:-=c:it=' ===::::::::t====tt:::::::===::it:=:-::====::::ti